Another year, loads of work and now we start to see the fruits of our hard work. We have slowed down writing and spent hours exploring the nature of random numbers, and by this pseudo random numbers. We make no claim that our work extends to true random numbers, and may never since the days of tossing dice are long gone.
First, Gamma Goblin clocked in a respectable 9.17 percent. Yet compared to QQQ at 20.73, particularly in the last part of the year, it fell short. Yet the Goblin never had the market exposure of its benchmark, and should outperform in the inevitable correction. Sterling Gamma Goblin
Introducing Sterling Steeplechase (Sterling Steeplechase)
Most quantitative strategies begin with market data — searching for patterns in prices, correlations between assets, signals in the noise. We took a different path.
We began by studying randomness itself. Fair coin flips. Synthetic noise. Pseudo-random sequences. We developed methods to understand random processes so deeply that we can detect the slightest deviation from pure randomness.
This may sound counterintuitive. But any deviation from randomness — however small — can be harnessed.
The Research
Most of our work in2025 involved random processes. We built simulations. Thousands of them. Casino games with fair coin flips. Continuous random sequences. Synthetic data with precisely known statistical properties. Environments where there is no information, no edge — only pure mathematical randomness.
Our methods detected structure. Not by beating randomness — that is impossible — but by identifying systematic deviations from pure noise.
Only then did we apply these methods to markets.
What We Found
Markets are often described as random. They are not purely random. There are subtle deviations — exploitable structure that our methods were built to detect.
We tested across 23 liquid ETFs spanning equities, fixed income, commodities, and precious metals. Nine years of out-of-sample data. Core methodology developed entirely on synthetic data before market application.
Every instrument was profitable.
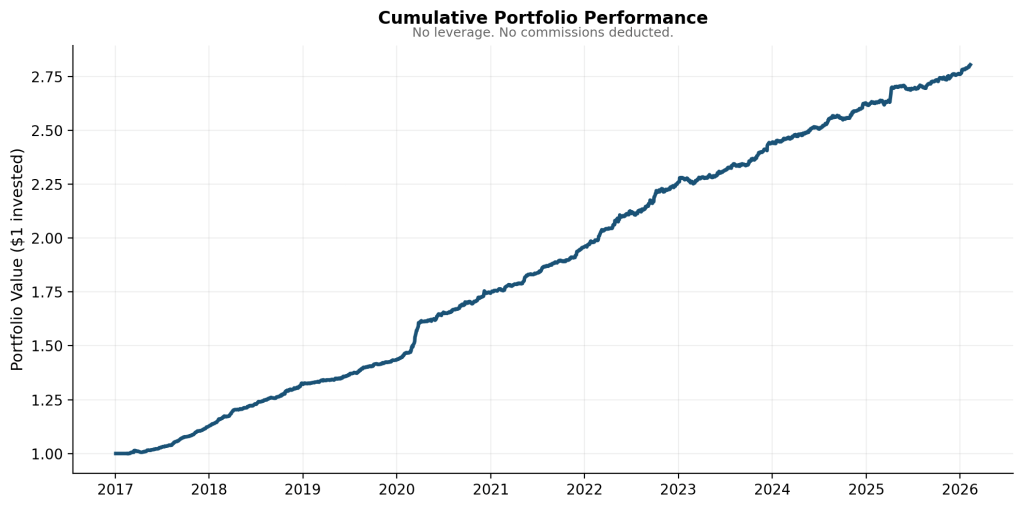
Results
Out-of-sample performance: 23 ETFs, volatility-weighted portfolio, 2017-2025. No leverage applied.
Performance Metrics
Annualised return: 11.6%
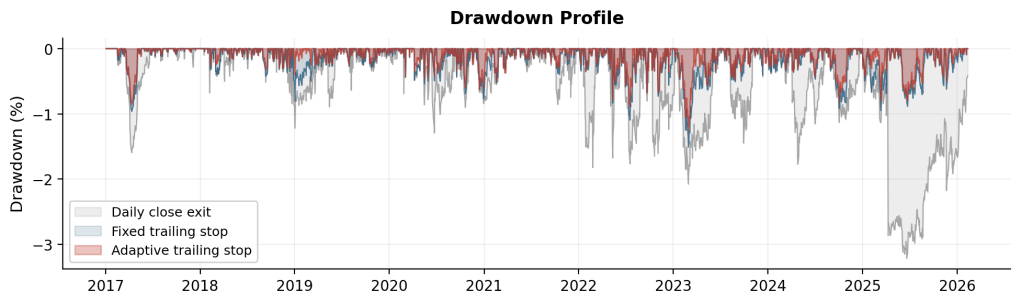
Maximum drawdown: 1.3%
Sharpe ratio: 4.84
Portfolio Composition
ETFs tested: 23
ETFs profitable: 23
Asset classes: 5
Out-of-sample period: 2017-2025
Yes, we know — backtests prove nothing.
We agree. That’s why we didn’t start with markets. We built the methodology on synthetic random processes — fair coin flips, pure noise, environments where overfitting is mathematically impossible.
The edge was proven to exist in pure randomness before we touched a single price. The market backtest above is confirmation, not discovery.
Statistical validation: Hundreds of simulations. Multiple random seeds. P-values below 0.000001.
Why it should persist: The edge is structural — it emerges from mathematics, not from market inefficiency. The structure we exploit is inherent to how volatility behaves. It cannot be arbitraged away.
Engineering Discipline
Every calculation is unit-tested. Over 350 automated tests validate our methodology. This is not a spreadsheet backtest — it is production-grade research infrastructure.
Current Status
Sterling Steeplechase is live, trading our own capital. We welcome conversations with institutional investors, family offices, and research partners who share our commitment to rigorous, mathematically-grounded approaches.
Detailed methodology available under NDA.

Leave a comment